On March 9, 2009, the Dow Jones, the S&P 500, and the NASDAQ all bottomed out in the aftermath of the “Great Recession”. Since that date, all three indices have experienced rapid recoveries and expansion.
We’ve now experienced nearly 10 years of expansion with few speedbumps along the way. When listening to commentary by economists, fund managers and analysts, the only thing everyone agrees on is that a market correction is inevitable; however, when the correction will happen is a matter of wide debate.
Here, we will look at some potential evidence of a future market volatility. We will also look at strategies to help minimize porfolio impact.
What’s Happening in the Markets – Potential Indicators
Interest Rates
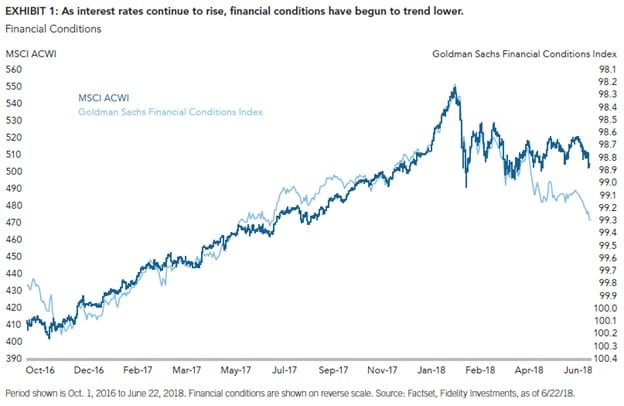
In the last 18 months, both the Bank of Canada and the U.S. Federal Reserve have hiked their key rate multiple times. The Fed has hinted at up to six more rate increases through 2020.
Rising interest rates make it more difficult for households and businesses alike to borrow money, and increases the servicing cost on existing variable-rate debts. On a business level, more difficulty in borrowing money and increased servicing costs mean less growth and lower earnings. Over time, rising rates act as a headwind to economic growth. The chart shown below bears out:
Price/Earnings Ratios
The price/earnings (P/E) ratio is calculated by dividing the company’s stock price by its earnings per share (EPS). P/E ratio tells us what an investor is willing to pay for $1 of earnings. Because a company’s stock price depends not only on earnings but also on the number of shares outstanding, the company’s P/E ratio is a better indicator of a company’s value than its stock price and allows for apples-to-apples comparison between companies in a particular industry.
Depending on the index, historical P/E ratios have been between 15 and 25 on average. For example, the S&P 500’s historical average P/E ratio is about 17. The S&P’s 12-month trailing P/E ratio stands at 24.40, 44 per cent higher than its historical average.
Higher than average P/E ratios indicate investors are paying more for a dollar of earnings than they have on average, so that dollar of earnings is more and more expensive as P/E rises.
P/E ratios running higher than historical average can hint at future market volatility.
Yield Curves
In a normal economy, the yield for long-term debt instruments is higher than the yield on short-term instruments. Investors expect to be compensated for lending money with a longer duration to maturity, because they are exposed to various risks that are less prevalent in short-term debt instruments. Thus, a normal yield curve will curve upwards. As market expansion continues and central banks raise rates, the yield curves will flatten out and even become inverted.
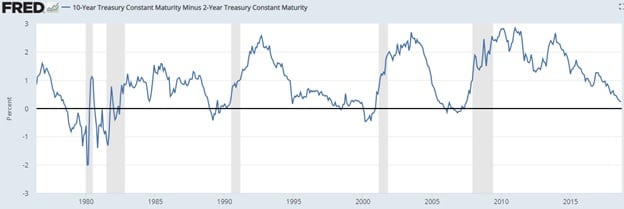
The inverted yield curve is considered a leading indicator of market corrections. A widely-used comparison when looking at yield comparisons is the spread between 2-year vs 10-year yields. Historically, 2-year yields greater than 10-year yields have shown to correlate with recession and its the accompanying market instability. See the below chart:
While we are not currently experiencing an inverted yield curve, the chart shows that the difference between a 10-year yield and a 2-year yield is declining. The black line (a differential of 0 per cent) represents a flat yield curve and a negative differential indicates an inverted curve. You will notice that recessionary periods (the grey areas) tend to follow inverted yield curve instances within a short time frame.
Now, let’s look at some strategies to deal with increased market volatility.
The Late-Stage Investing Playbook
Defensive Equities Versus Cyclical Equities
Firstly, investors can increase their defensive equity weighting and reduce their cyclical equity weighting.
As the name implies, defensive (or “non-cyclical”) equities tend to be less volatile than the index, so as markets pull back, defensive equities theoretically do not pull back as much as the index. For example, the index drops by 10 per cent, but a defensive equity only drops by 6 per cent.
On the other hand, cyclical equities’ valuations are affected by the ups and downs of the overall market, rising and falling with the business cycle. Cyclical equities are more volatile than defensive equities and tend to rise and fall as much as (or more than) their index. For example, the index drops by 10 per cent, and a cyclical equity drops by 12 per cent.
Examples of defensive equities include companies that produce stable, predictable earnings, dividend providers, utilities companies, consumer staples, health care, and real estate investment trusts (REITs). These kinds of companies are perceived as defensive because consumer demand for these products and services persists, regardless of market conditions.
Tech Weighting
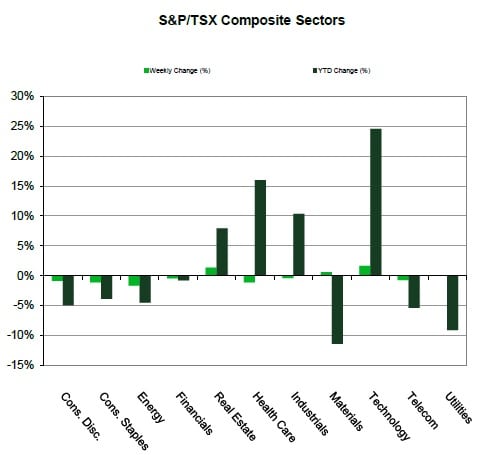
Related to the Defensive vs Cyclical balance is the influence of the tech sector on overall growth. The Tech sector is generally more cyclical and has driven the majority of growth in 2018. See the below chart, showing the TSX Composite’s 2018 by-sector growth figures as of September 14th.
As we can see here, Technology is the main growth driver, at a Year-to-Date (YTD) increase of 24 per cent. The second leading sector is Health Care, at just over 15 per cent. YTD, the TSX is at -1.2 per cent.
A portfolio rebalancing to reduce tech weighting locks in some profits and allows the investor to re-position their portfolio into more defensive assets.
The Case for Holding More Cash
In an expanding economy, holding (or hoarding) too much cash presents the disadvantage of opportunity cost, since that cash is subject to inflation but very little growth. This means that hoarding cash will erode your purchasing power over time.
A key benefit of holding cash, especially when markets cycles are near their highs, is that cash acts as a portfolio buffer, protecting you from the full brunt of a market downturn. So, tactically increasing a portfolio’s cash position is a great way to take some downside risk off the table.
Many fund managers, especially those managers with more defensive mandates, actively tweak their funds’ weightings already.
In Summary
It’s important to keep in mind that any one indicator or piece of evidence is not necessarily reliable on its own; however, we can see how increasing bank rates, climbing P/E ratios and a flattening yield curve are all pointing in the same direction.
Reading these tea leaves, we can formulate a strategy to reduce the downside risk to portfolios through a mix of re-balancing within equities from cyclical to defensive, trimming positions in the most growth-oriented sectors/funds, and tweaking the cash weighting within portfolios.
If you have any questions about your portfolio’s asset allocation or cash weighting, please contact our office.
Sources: Fidelity Investments, Federal Reserve Bank of St. Louis, Advisor’s Edge, Bank of Canada, TD Asset Management
This information is provided for general information purposes only. It does not constitute professional advice. Please contact a professional about your specific needs before taking any action.


