“Volatility is far from synonymous with risk” – Warren Buffett
Volatility Returns to the Markets
U.S. markets took a beating this week, as a rise in bond yields and inflation fears led to historic drops for the Dow Jones index on Monday and Thursday.
Since last Friday, the daily return of the DOW has been:
Friday: Minus 666 points
Monday: Minus 1,175 points
Tuesday: Plus 567 points
Wednesday: Flat
Thursday: Minus 1,033 points
Today: Plus 330 points
Current Index Value: 24,190
The DOW and S&P 500 are down about 10 per cent from their highs two weeks ago.
In absolute terms, the two 1,000+ point falls are the largest daily point losses in DOW history. However, the index has increased so much that comparing today’s point losses to previous eras is not relevant. The DOW has doubled in value in seven years and we must get used to seeing larger daily point movements.
In percentage terms the Dow’s 4.6 per cent loss on Monday was the worst since August 2011 and falls outside the top-20 of all-time losses. It was just the 25th worst loss since 1960.
The Dow’s largest one-day percentage loss was the 22.6 per cent Black Monday crash on Oct. 19, 1987. In point terms, that was “only” 508 points. In second place, the Dow crashed 12.8 per cent on Oct. 28, 1929. It retreated just 38 points that day.
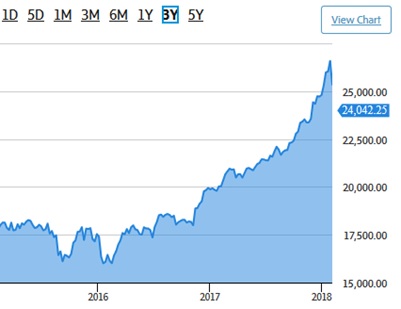
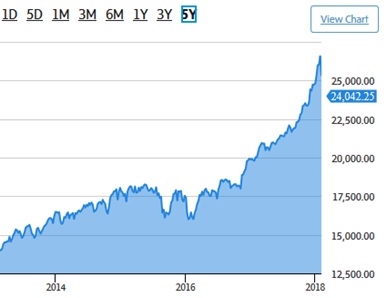
The pullback has only reverted prices to where they were in December. The one-month chart looks scary….
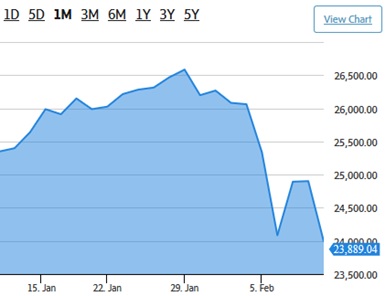
….however, it barely registers on the three and five-year charts:
The volatility we’re experiencing this week is due to a technical, market structure event – not a fundamental one. Monday’s dramatic sell-off was a function of large U.S portfolios and pension funds rotating away from strong performing equity investments to strategically re-balance portfolios. The overwhelming nature of this move was exacerbated by robotic trading price sets and momentum technicals and then further compounded by retail trading. This is not a repeat of 2008, where we witnessed a credit event and a housing-related issue (sub-prime mortgage market collapse).
Earnings season has been positive with Q4 earnings on the S&P 500 on track for the most beats this cycle. We still have an environment with coordinated global economic growth, and provided market volatility does not erode broader confidence, the underlying fundamental picture remains supportive. We are in an economic world that is positive and continuing to expand. With that said, we are in the later stages of the market cycle. Because of elevated valuations and central bank renormalization, we should expect more volatility in the next five years than the previous five years.
Conclusion
Pullbacks are normal. Five per cent corrections happen on average three times per year. In the last 30 years, there have been 30 months during which global equities have fallen by at least 6.3 per cent in six business days. Markets took on average four months to recoup the loss.
What Can You Do?
For investors in the accumulation phase, this is good news. You are now able to purchase units at lower entry prices. We feel much more comfortable deploying money into portfolios than we did a month ago. This pullback coincides very well with RRSP season and now is a great time to make a purchase. Do not worry about trying to time the bottom perfectly. History has shown time and time again that buying on dips such as this one will lead to favourable results in the future.
For retired or soon to be retired investors, please try to ignore the noise. This is the reason we select a more conservative investment to fund your monthly payments. Your short-term cash flow is not fully exposed to markets, and the balance of your portfolio has enough time to recover from dips.
Please feel free to contact us anytime with any questions or comments.
From the entire You First team, Happy Family Day weekend!
Weekly Market Update – By The Numbers
North America
- The TSX closed at 15035, down -571 points or -3.66% over the past week. YTD the TSX is down -7.24%.
- The DOW closed at 24191, down -1330 points or -5.21% over the past week. YTD the DOW is down -2.14%.
- The S&P closed at 2620, down -142 points or -5.14% over the past week. YTD the S&P is down -2.02%.
- The Nasdaq closed at 6875, down -366 points or -5.05% over the past week. YTD the Nasdaq is down -0.41%.
- Gold closed at 1315, down -15.00 points or -1.42% over the past week. YTD gold is up 0.38%.
- Oil closed at 59.05, down -6.04 points or -9.28% over the past week. YTD oil is down -2.27%.
- The USD/CAD closed at 0.7953, down -0.0091 points or -1.13% over the past week. YTD the USD/CAD is unchanged 0.00%.
Europe/Asia
- The MSCI closed at 2045, down -168 points or -7.59% over the past week. YTD the MSCI is down -2.76%.
- The Euro Stoxx 50 closed at 3326, down -197 points or -5.59% over the past week. YTD the Euro Stoxx 50 is down -5.08%.
- The FTSE closed at 7092, down -351 points or -4.72% over the past week. YTD the FTSE is down -7.75%.
- The CAC closed at 5079, down -286 points or -5.33% over the past week. YTD the CAC is down -4.40%.
- DAX closed at 12108, down -677.00 points or -5.30% over the past week. YTD DAX is down -6.27%.
- Nikkei closed at 21383, down -1892.00 points or -8.13% over the past week. YTD Nikkei is down -6.07%.
- The Shanghai closed at 3130, down -332.0000 points or -9.59% over the past week. YTD the Shanghai is down -5.35%.
Fixed Income
- The 10-Yr Bond Yield closed at 2.83, down -0.0200 points or -0.70% over the past week. YTD the 10-Yr Bond is up 17.92%.
Sources: Dynamic Funds, Globe Investor, Yahoo! Finance