Happy New Year to all You First clients, and we wish you a healthy and joyful 2022.
Markets are nearing the 10% decline mark to start the year and you have likely noticed a drop in the value of your investments.
Let’s jump right to a chart: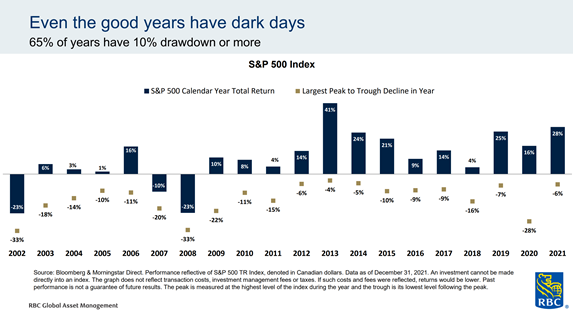
10% pullbacks happen all the time. 65% of all S&P 500 (US index) calendar years have seen a 10% correction or larger. In other words, if you are a long-term participant in equity markets, you should expect a 10% decline in markets every other year. Markets declined 10% or more in 2010, 2011, 2015, 2018, and 2020, so we are right on pace.
The positive news is that we have experienced two very strong years for North American equity markets. 2021 ended much the same way it began, with continued uncertainty surrounding the path of the global pandemic but with most equity markets finishing the year with healthy returns. The TSX index ended the year just below its all-time high and up ~21% for the year. The S&P 500 hit its record high on Dec 29th and ended 2021 up almost 29%.
Inevitably, the pace of growth will slow after the record-breaking double digit returns of 2021. While markets are down to start the year, the consensus is for 2022 to be a good (not great) year for equity markets supported by still favourable earnings growth, while fixed-income continue to lag in the face of rising rates. Along with an expected modest return for equities, this year will likely be much bumpier ride as shifting monetary policy impacts market liquidity. 2022 is a year for cautious optimism and tactical opportunities. This is not the stage of the cycle for all-in optimism, but nor is it time to be fearful.
Historically speaking, a big year for the markets like last year does not necessarily lead to a poor follow up year. The average return after a greater than 25% return year has been 14%, with almost 80% of all the years finding their way into the black. The odds for a positive year following a big up year, like 2021, increase to 94% when conditioned on economic activity.
Regardless of where we are in the market cycle, it’s important to take a disciplined approach to investing and stay focused on your long-term financial goals. We recommend you maintain a diversified mix of asset classes in your portfolio to maximize potential returns and minimize risk. Regularly reviewing and rebalancing your portfolio also helps you remain on track.
We are here to support you in achieving your financial goals. Please do not hesitate to contact us. Now on to the presentation!
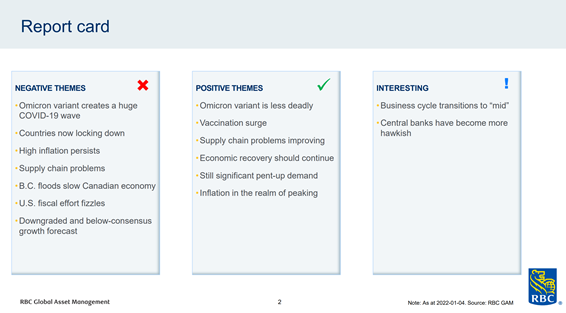
Economic report card: A basic summary of the positive and negative economic themes currently influencing markets. Economic forecasts for 2022 are still positive, but have been cut down due to Omicron, drag from supply chains, China slowdown, energy costs, fiscal headwinds, monetary reversal.
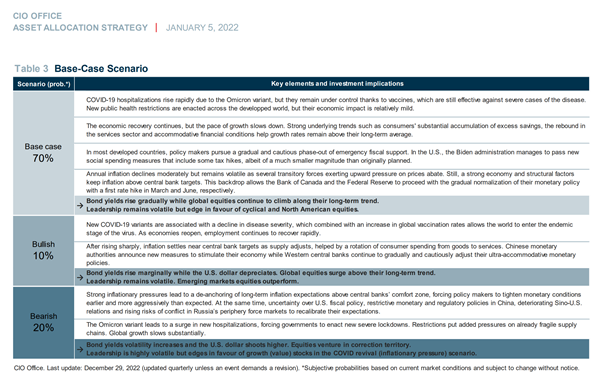
Base-case, best-case, worst-case. National Bank’s CIO provides the neutral case (70%) scenario, and what it would take for us to see better-than (10%) or worst-than (20%) expected result in the next year.
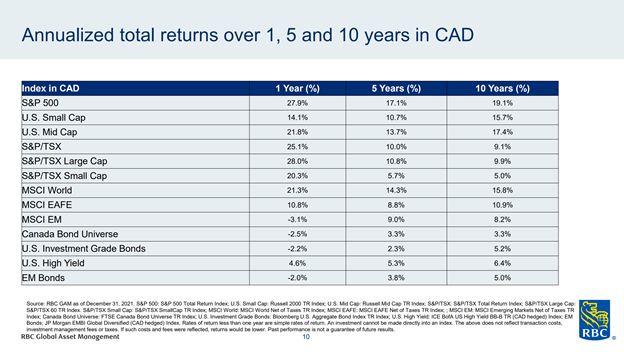
Annualized returns: Above are the 1, 5, and 10-year annualized returns for the major benchmarks. Equities outperformed fixed-income and the US has been the strongest equity market. Last year, the Canadian index (TSX) outperformed the US index (S&P 500).
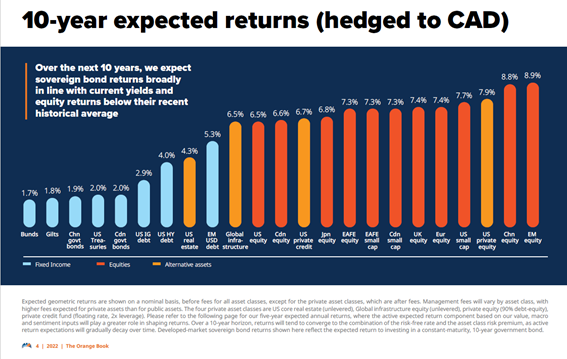
Expected returns for the next decade: Mackenzie Investments provides the following 10-year projections for the major equity and fixed-income categories. I don’t normally put much weight on market forecasts, but this chart is here to point out the large divide between fixed-income and equity projections. The low-yield environment + the prospect of rising rates created by central banks makes for a challenging, very low single digit return environment for fixed-income.
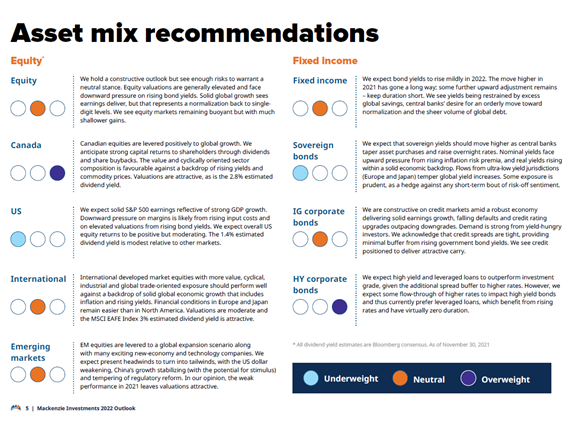
Asset mix recommendations: Equity over fixed income, domestic over global. Underweight USD. This is what most wealth firms are recommending in this environment.
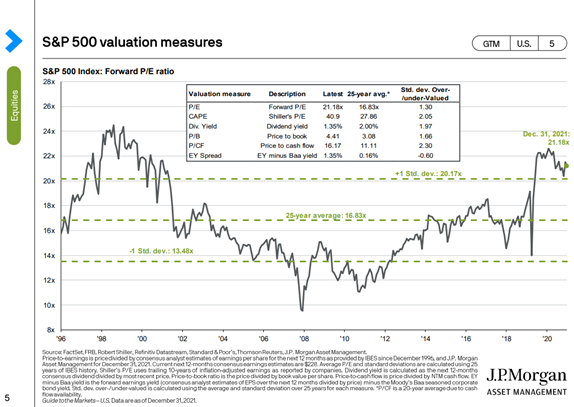
S&P 500 Valuation Measures: Most valuation metrics show that the US market is overvalued relative to historical norms.
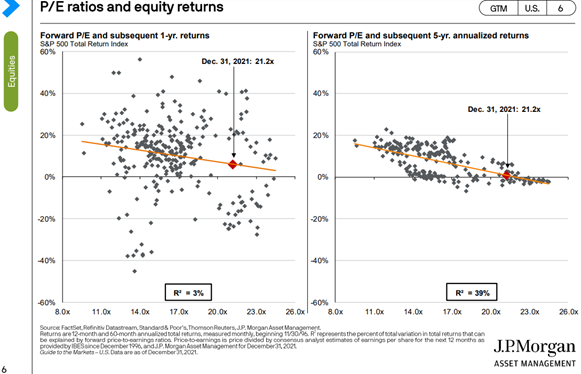
Current valuations (P/E) and subsequent 5-year returns. This chart is important in the management of all our expectations. At current valuations, market history suggests that average annual return for the next 5-years will be in the low single digits. After 12-13 years of relatively straight-line market growth, a long-term investor should not be surprised that markets could take a breather for a few years.
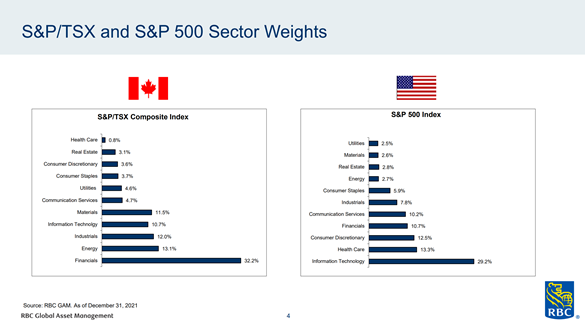
Index weights: It’s important to know what’s inside the TSX & S&P 500. Canada is known for its narrow economy of financials (banks & insurance companies), energy, and industrials (construction and manufacturing). The 10% Canadian IT sector is almost entirely Shopify, and the 0.8% health care sector is mainly Cannabis companies. The U.S. economy is broader, more diversified, and compliments the TSX well. Its largest sector is IT (the major tech giants – Microsoft, Amazon, Apple, Alphabet…), Health Care, and Consumer Discretionary.
For continued reading, Fidelity provides a detailed US sector outlook on its website: https://www.fidelity.com/learning-center/trading-investing/2022-outlook-sectors
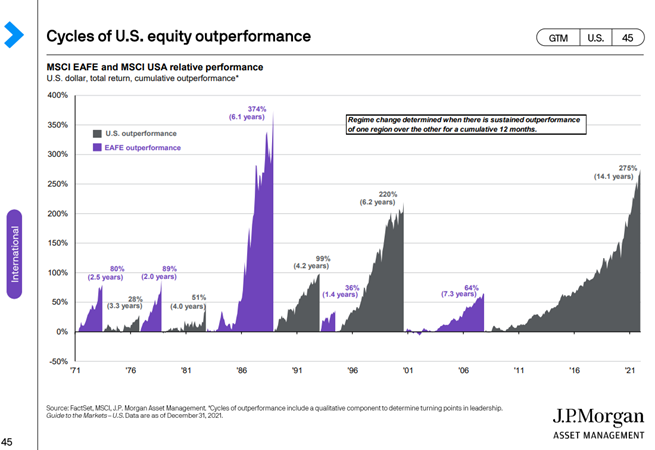
US vs. International (Europe, Asia): Historically the US (black) and International (purple) markets have see-sawed with outperformance. The US has been winning this race for the past 14 years. Could it soon be the international market’s turn to outperform?
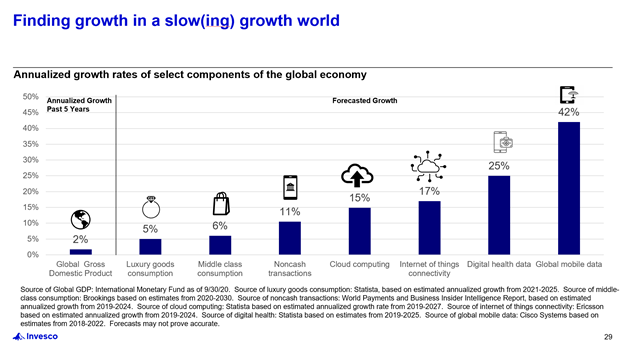
Areas of growth: We tend to present economic data in average or generalized terms. Within such projections, there are areas that are expected to see higher-than-average future growth. Not surprisingly, many of these areas are in the electronic / digital sector, which is why our portfolios tend to have a healthy allocation to the IT sector.
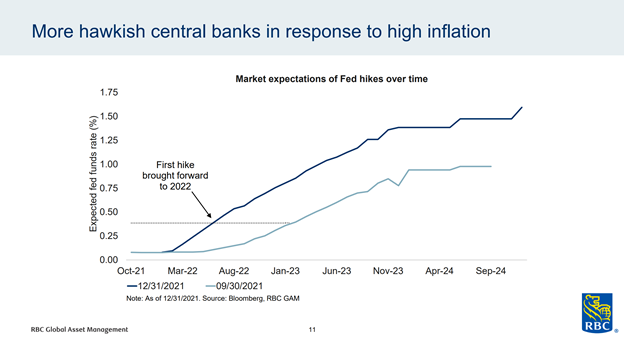
Will central banks raise interest rates in 2022? Higher and faster than expected inflation data in 2021 will likely lead to several rounds of rate increases in the next 24 months. The market is currently forecasting two 0.25% rate increases in 2022, and potentially another three in 2023.
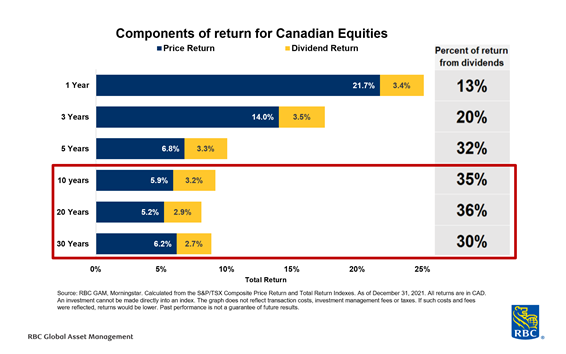
Percentage of returns from dividends: Dividends have always been an important part of the return stream. The above chart shows that across longer timelines, dividends are responsible for a over a third of the overall return.
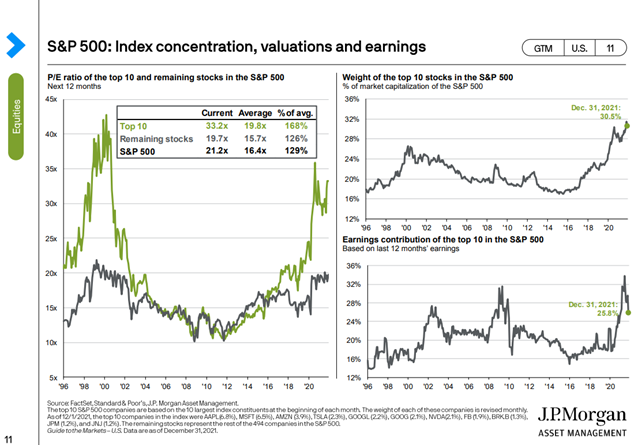
The big get bigger: The major US tech giants dominate the top 10 of the US Index (S&P 500) and currently make up 30% of entire index weighting. 494 companies make up the other 70%.
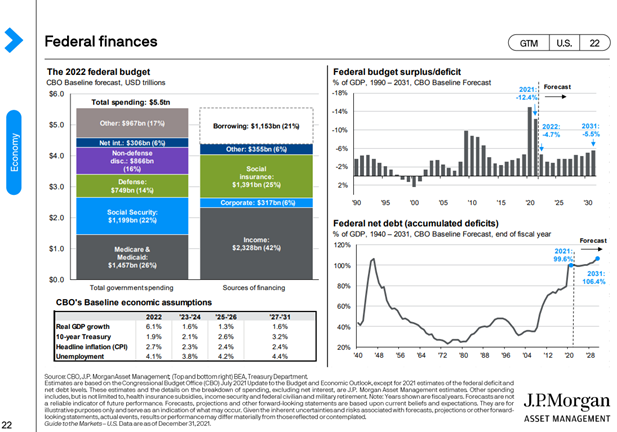
Evolution of government budgets: This is an interesting chart showing the US government’s federal budget and the evolution of its surplus/deficit and debt ratios.
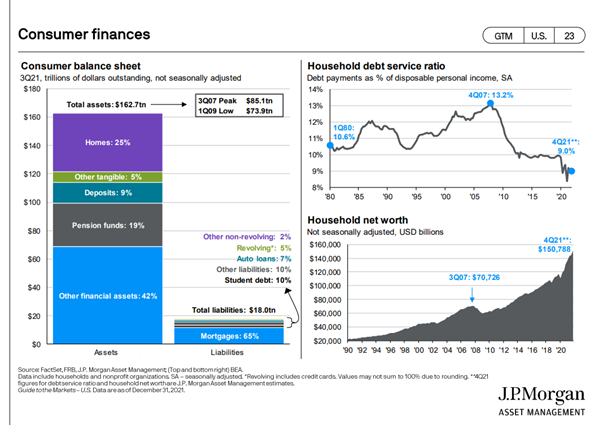
Evolution of consumer budgets: A similar chart as above, but for the US consumer.
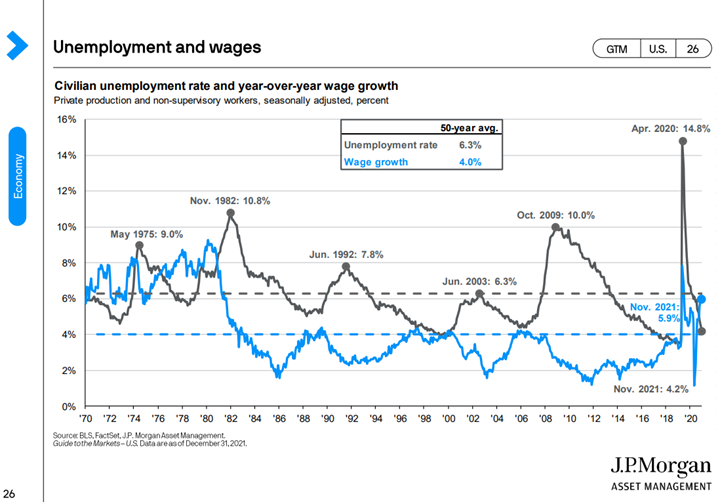
Unemployment and wages: A reminder of just how bad things were at the start of the pandemic, and also the robust wage growth caused by current labour dynamics and inflation.
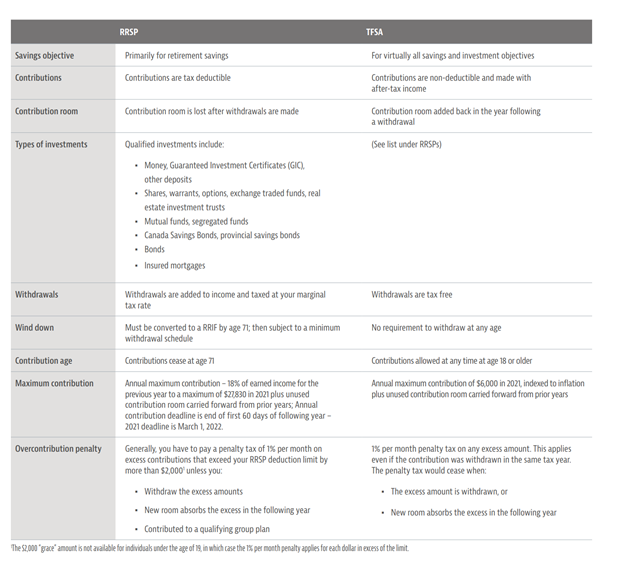
RRSP vs TFSA: You can contribute another $6,000 into your TFSA for 2022, and the 2021 RRSP deadline is March 1, 2022. The chart above provides a full comparison of both accounts.
Sources: RBC GAM, National Bank CIO, Mackenzie Investments, J.P. Morgan, Invesco, Canada.ca