Please note that this will be our final market update until early-May, when the April 30th tax filing deadline has passed.
Myles Zyblock, Chief Investment Strategist at Dynamic Funds, has shared his market update for 2021 year-to-date. Please read on below.
A New Sherriff’s in Town
A seemingly endless wave of government stimulus and the accelerating pace of vaccinations have shifted the narrative from lockdown to re-opening, bust to boom, and deflation to inflation over the course of a few short months.
The punctuated rotation within the equity market reflects the changing nature of this story. Styles, sectors, and stocks that led soon after the 2020 market low have taken a backseat to a new set of bests.
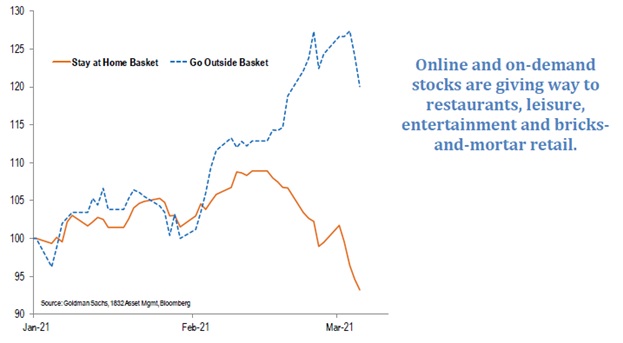
Those populating today’s performance leaderboard are cheaper, smaller, cyclical, and more likely to be found in the “old economy” segments of the equity market. Said differently, the investment focus has shifted from “staying at home” to “going back outside” (see the below Chart of the Week):
More Stocks Outperforming Doesn’t Equal More Market Cap Outperforming
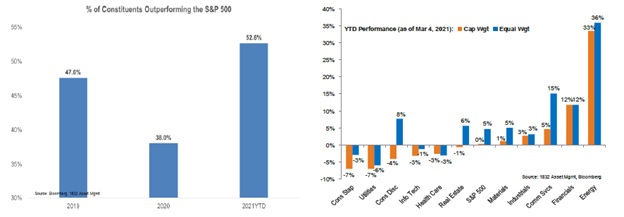
- About 53% of the S&P 500’s constituents are outperforming the benchmark on a year-to-date basis. Despite this broadening participation, the equity index has not been shooting the lights out. Remember that the S&P 500 is a capitalization-weighted index.
- There are a couple of reasons behind this performance dynamic: First, smaller companies within the index are outperforming. This can be seen by the equal-weighted indexes outperforming their market-cap weighted counterparts. Second, recent leadership is located mainly within the areas of the market where there isn’t much in the way of market capitalization (e.g., Energy, Financials).
- Capitalization-weighted Technology, Health Care and Consumer Discretionary, which represent 51.4% of total index market cap, have been important counterweights on S&P 500’s performance. There simply has not been enough market cap rising to significantly offset this drag emanating from the benchmark’s behemoths.
Bond Yields Playing a Role in the Rotation
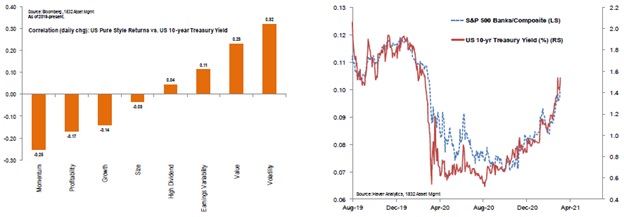
- The 10-year Treasury yield has risen by almost 60 basis points in 2021 and by more than a full percentage point over the past 6 months. Rising bond yields probably reflect the prospect of stronger economic (and inflationary) activity, and a higher rate used to discount a company’s future earnings.
- As a result, higher bond yields often act as a drag on the relative performance of higher-duration equities (e.g., momentum stocks, growth stocks). Given their association with an improved economy, rising yields are also closely linked to the outperformance of stocks with lower multiples or more variable earnings streams.
- Banks offer one example of a group which not only carries higher than average earnings variability, but lower valuation multiples. This is probably a reason why their relative performance has been so closely and positively associated with bond yields in recent years.
Valuations and Bond Yields
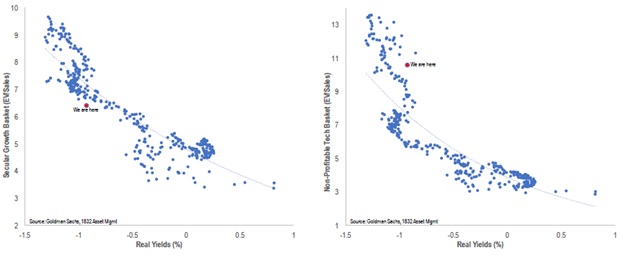
- Secular growth stocks often carry higher valuation multiples than the market, simply because investors value their distant future earnings so much more than those of the present. However, it is this exact dynamic which also makes their valuations more sensitive to changes in the discount rate. Higher interest rates are often associated with lower EV/sales multiples for these secular growers, and vice versa in the case of declining interest rates. The good news is that these stocks can often overcome the valuation challenges posed by rising interest rates through strong future earnings delivery.
- The same cannot be said for all high-multiple stocks. One of the big performance winners over of the past year has been a group of technology companies with no earnings. Yes, the ones with no earnings. These stocks tend to be hyper-sensitive to changes in interest rates, simply because of the outsized weight that is being afforded to their future earnings streams. Stocks with these characteristics are where we see the greatest vulnerability to a prolonged period of rising interest rates. Many of these story-driven stocks might never be profitable or, at the very least, might face significant challenges to live up to expectations.
Other Faces of the Rotation
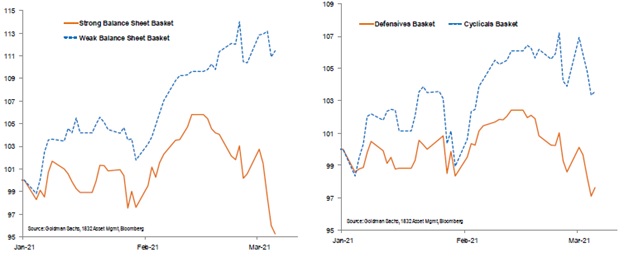
- The performance of companies with pristine balance sheets have taken a backseat to those with higher leverage and lower liquidity. Over the long term, companies with strong balance sheets tend to outperform, but it is the financially frail which tend to benefit most during periods of surging economic activity and corporate cash flows. This is a story no different from what we are seeing in the bond market, where high-yield corporate bonds have started to significantly outperform their high-quality counterparts.
- Another way one might gain insight into the recent rotation is through the lens of economic leverage. Cyclical stocks, or those whose prospects are most closely aligned with the business cycle, have been pulling away from their non-cyclical (i.e., “defensive”) brethren. The latter group are more aligned with the necessities of life and, therefore, less geared to the economic cycle.
Bottom Line
Many of the sectors, industries and stocks which were left for dead in the aftermath of the global health crisis are showing some renewed signs of life. These recent outperformers have tended to be smaller, cheaper, more cyclical, and less interest rate sensitive than the overall market. Perhaps, the mountain of global policy stimulus and vaccination programs are finally demonstrating their intended effect.
Sources: Dynamic Funds