“There never was a good war, or a bad peace” – Benjamin Franklin
Correction Notice – 2019 Market Results
In last week’s 2019 Market Results briefing, we made the following incorrect statement (which has since been corrected):
“The S&P 500, one of the major U.S. indexes, led the way with a final return of 35.24%.”
As the briefing’s following table correctly showed, it was the Nasdaq (another of the major U.S. indexes) that returned 35.24%. The S&P 500 returned 28.88% in 2019. We apologize for this error.
Market Impact of the U.S.-Iran Escalation
Last week, U.S.-Iran tensions escalated following the U.S. airstrike outside Baghdad International Airport, which resulted in the death of Iranian General Qassem Soleimani as well as Iraqi militia leader, Abu Mahdi al-Muhandis.
Middle East analysts view this as the most dramatic action since the standoff in May. Global leaders are calling for restraint, but this week, Iran retaliated with airstrikes on at least two Iraqi airbases housing American military forces. The U.S. Department of Defense stated that Iran launched “more than a dozen ballistic missiles” at the two airbases. President Trump said that the U.S. early detection system worked, so no American or Iraqi lives were lost.
Trump later signaled that tensions were de-escalating, saying “Iran appears to be standing down, which is a good thing for all parties concerned and a very good thing for the world”.
It remains to be seen whether tensions will escalate further. Only time will tell.
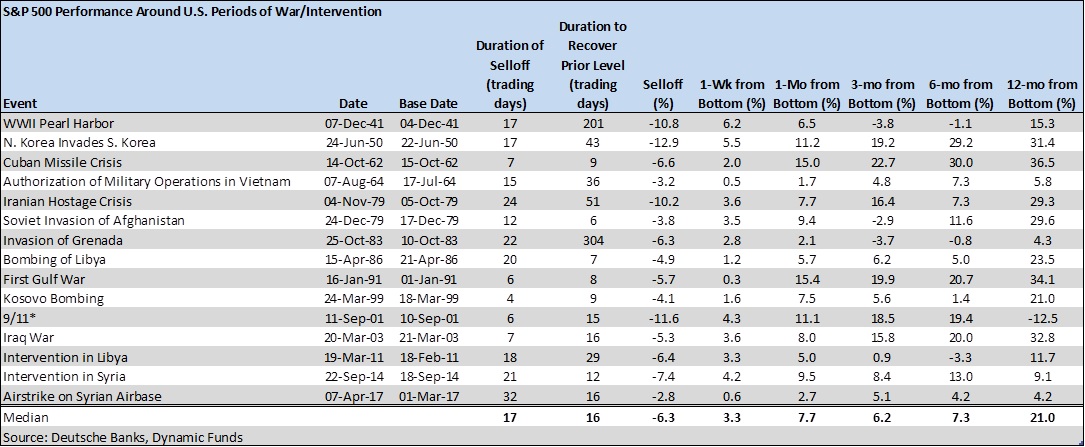
Turning our attention toward how these tensions will affect markets, Myles Zyblock, Dynamic Funds’ Chief Investment Strategist, provides the following data on previous U.S. wars and the impact to the S&P 500:
- The typical sell-off is relatively shallow at -6.3%. The range is from -2.8% for the recent airstrike in Syria in 2017, to -12.9% around the Korean war
- The duration of the selloff is generally short-lived. The median number of days of the selloff is 17 while it takes roughly an equal amount of time to recover at 16 days
- Lastly, 80% of the time, the market is up in the subsequent three months and 93% of the time in the following 12 months
If market history is repeated, then we should not expect any long-term negative portfolio impact as a result of the U.S.-Iran tensions. Indeed, any immediate pullback should be corrected in short order.
Please contact our office if you have any questions about your portfolio.
Weekly Update – By The Numbers
| North America | Friday Close | Weekly Change | Weekly % Change | YTD % Change |
| Canada – S&P TSX Composite | 17,234 | 168 | 0.98% | 1.00% |
| USA – Dow Jones Industrial Average | 28,824 | 189 | 0.66% | 1.00% |
| USA – S&P 500 | 3,265 | 30 | 0.93% | 1.05% |
| USA – NASDAQ | 9,179 | 158 | 1.75% | 2.30% |
| Gold Futures (USD) | $1,562.00 | $7.00 | 0.45% | 2.76% |
| Crude Oil Futures (USD) | $59.14 | -$3.90 | -6.19% | -3.38% |
| CAD/USD Exchange Rate | $0.77 | $0.00 | -0.52% | -0.60% |
| Europe / Asia | Friday Close | Weekly Change | Weekly % Change | YTD % Change |
| MSCI World Index | 2,378 | 15 | 0.63% | 0.85% |
| Switzerland – Euro Stoxx 50 | 3,790 | 17 | 0.45% | 1.12% |
| England – FTSE 100 | 7,588 | -34 | -0.45% | 0.42% |
| France – CAC 40 | 6,037 | -7 | -0.12% | 0.99% |
| Germany – DAX Performance Index | 13,483 | 264 | 2.00% | 1.77% |
| Japan – Nikkei 225 | 23,851 | 194 | 0.82% | 0.82% |
| China – Shanghai Composite Index | 3,092 | 8 | 0.26% | 1.38% |
| CAD/EURO Exchange Rate | € 0.69 | € 0.00 | -0.10% | 0.29% |
| Fixed Income | Friday Close | Weekly Change | Weekly % Change | YTD % Change |
| 10-Year Bond Yield (in %) | 1.825 | 0.037 | 2.07% | -4.90% |
Sources: Dynamic, Yahoo Finance, CNBC.com
This information is provided for general information purposes only. It does not constitute professional advice. Please contact a professional about your specific needs before taking any action.