The last decade was very rewarding for investors and at almost 11 years, we are still in the midst of the longest U.S. bull market ever. However, most major economies are exhibiting late-cycle signs and are posting lower GDP growth. This stage precedes a recession and is typically characterized by economic activity that is still positive but slowing. Interest rates usually increase, manufacturing slows, and employment begins to stagnate.
Further downside risks include the U.S. elections, global trade tensions, aging demographics, and technological disruption.
However, no two economic cycles follow the exact same path. For example, despite weaker corporate earnings, global equity markets showed renewed strength last year, and with several central banks cutting rates in recent months to encourage business activity, this may be a longer than usual “late-stage”.
We compiled 20 charts that summarize the economic and financial picture for 2019 and 2020:
1: 2019 Equity returns were strong, more than recovering from the 2018 pullback
After a turbulent finish in 2018, markets rebounded across the board in 2019 to end the decade on a strong note. Here are the 1, 5, and 10 year returns for the major indexes: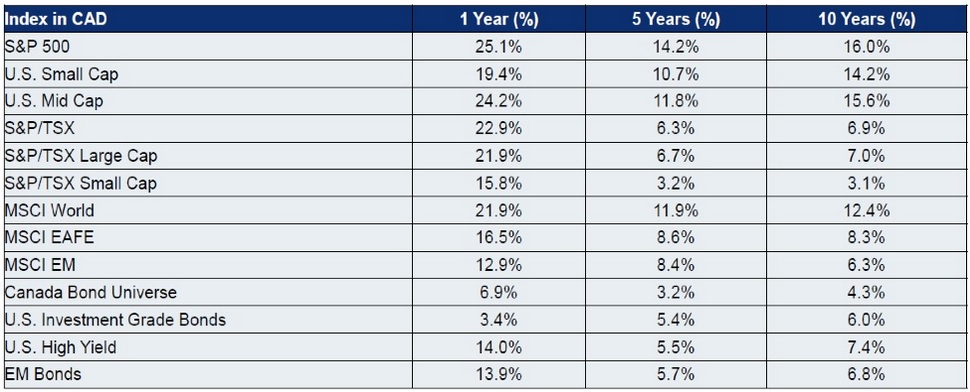
2 & 3: TSX (Canadian Market) and S&P 500 (U.S. Market) sector returns
Last year, the top-performing Canadian sectors were Information Technology, Utilities, Industrials, Materials and Financials. Overall, returns for the 11 S&P/TSX sectors were strong, except for Health Care. This sector declined 10.9%, led by the “return to earth” performance of many of the previous year’s “high-flying” cannabis stocks. One of the common themes across the best-performing sectors was the market favouring stocks that look like bonds (high-yielding sectors such as Utilities and Financials). 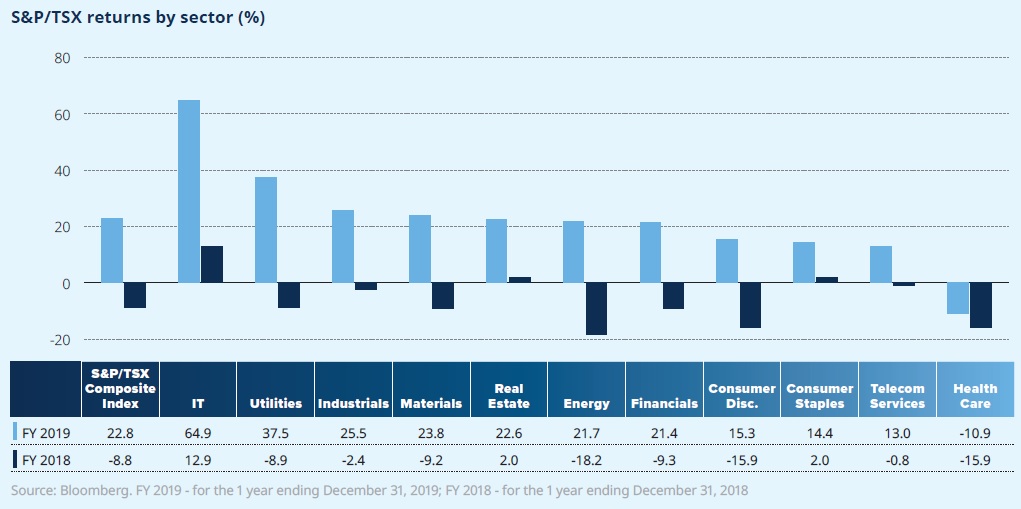
For the S&P 500, the strongest returns in 2019 were in the Information Technology, Utilities, Industrials, Materials and Financials sectors. The wide gap (75% for the TSX and 40% for the S&P 500) between the best and worst performing sector makes a strong case for diversification. 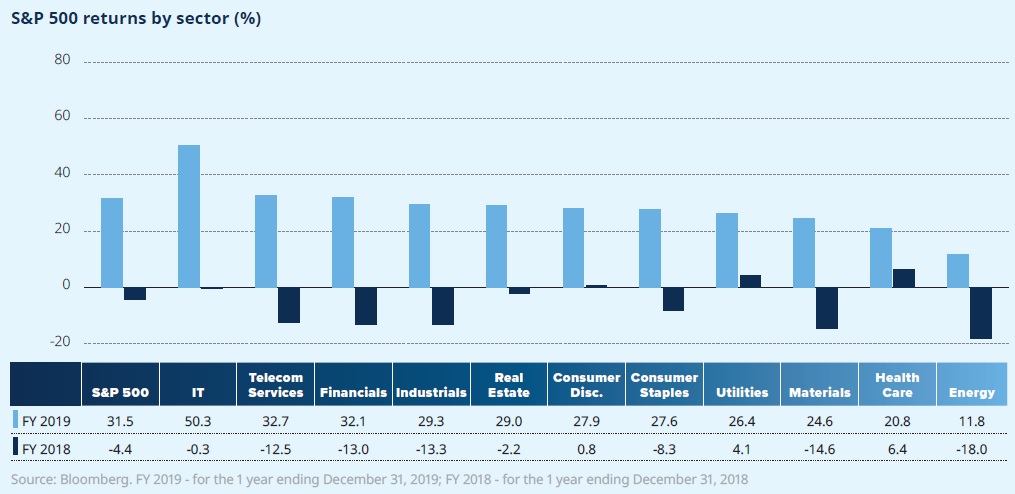
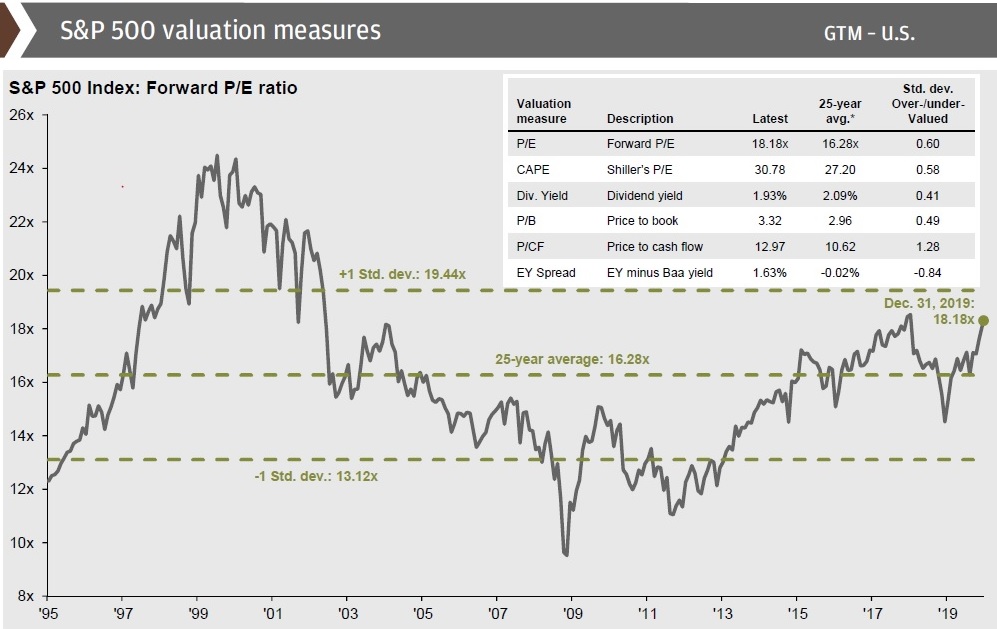
4: U.S. equity valuations to end 2019 were slightly above the historical average
The chart below tracks various valuations methods for the S&P 500. You can read more about the P/E ratio and expected market returns in Anthony’s article, New Decade, New Expecations.
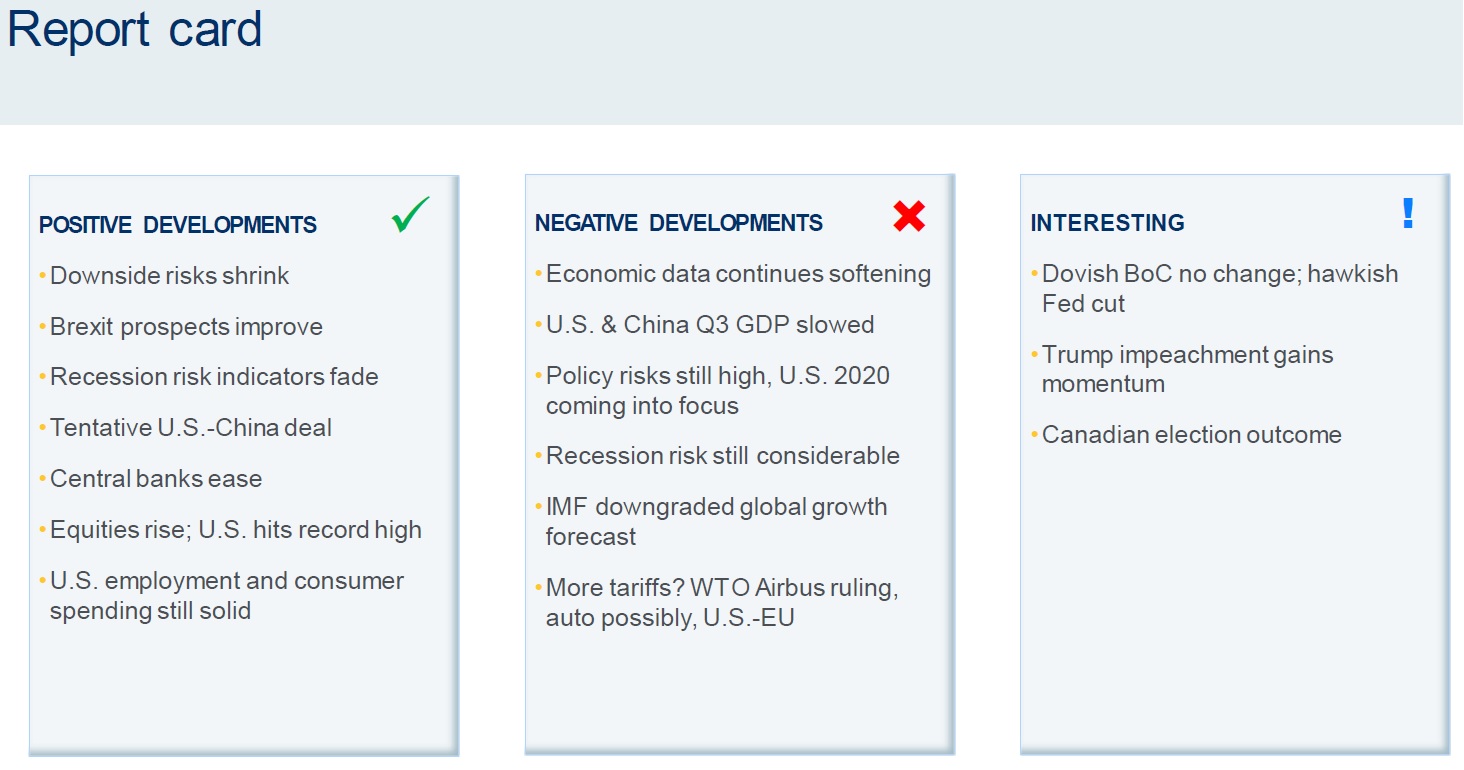
5: Economic Report Card
From RBC Global Asset Management (RBC GAM), here is an overview of recent positive and negative developments as 2019 wound down, as well as some “interesting” items that may end up in positive or negative territory when the dust settles.
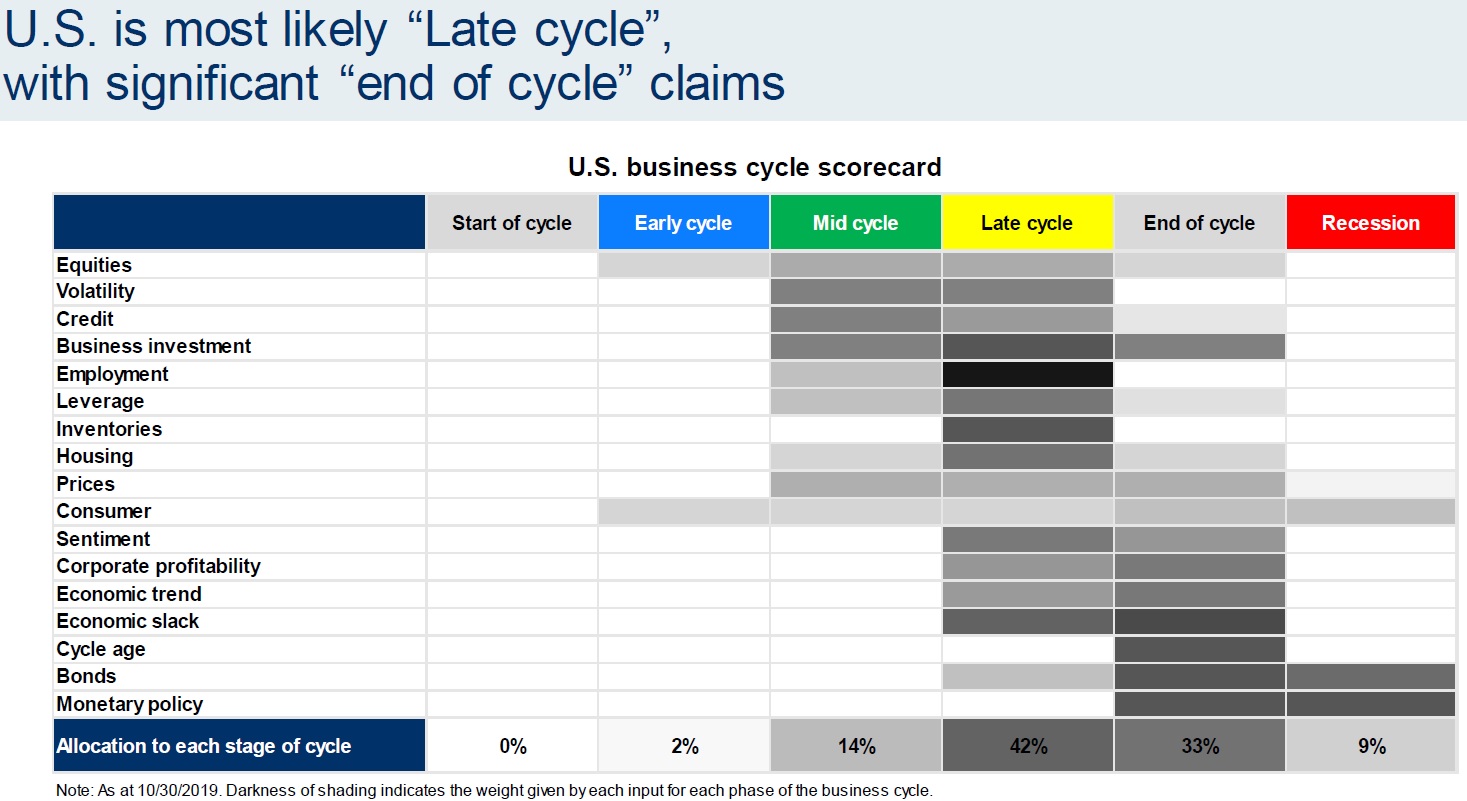
6 & 7: Most countries are exhibiting late–stage market signals
Another chart from RBC GAM. A gauge of various economic metrics suggest the U.S. is most likely in a “late cycle” phase.
Fidelity’s chart below presents a similar case. Most countries are firmly in-between the expansion and contraction phases. 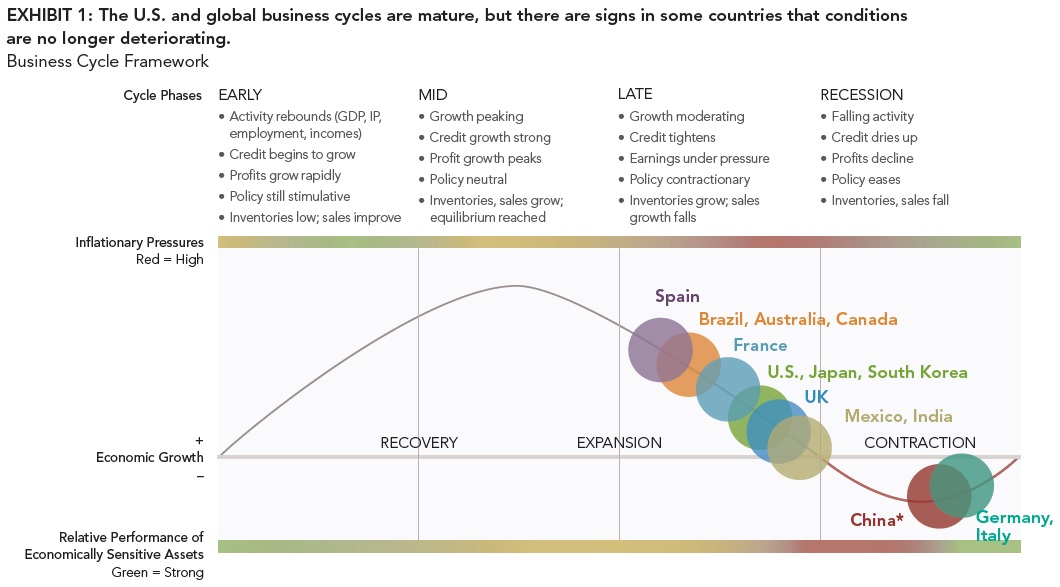
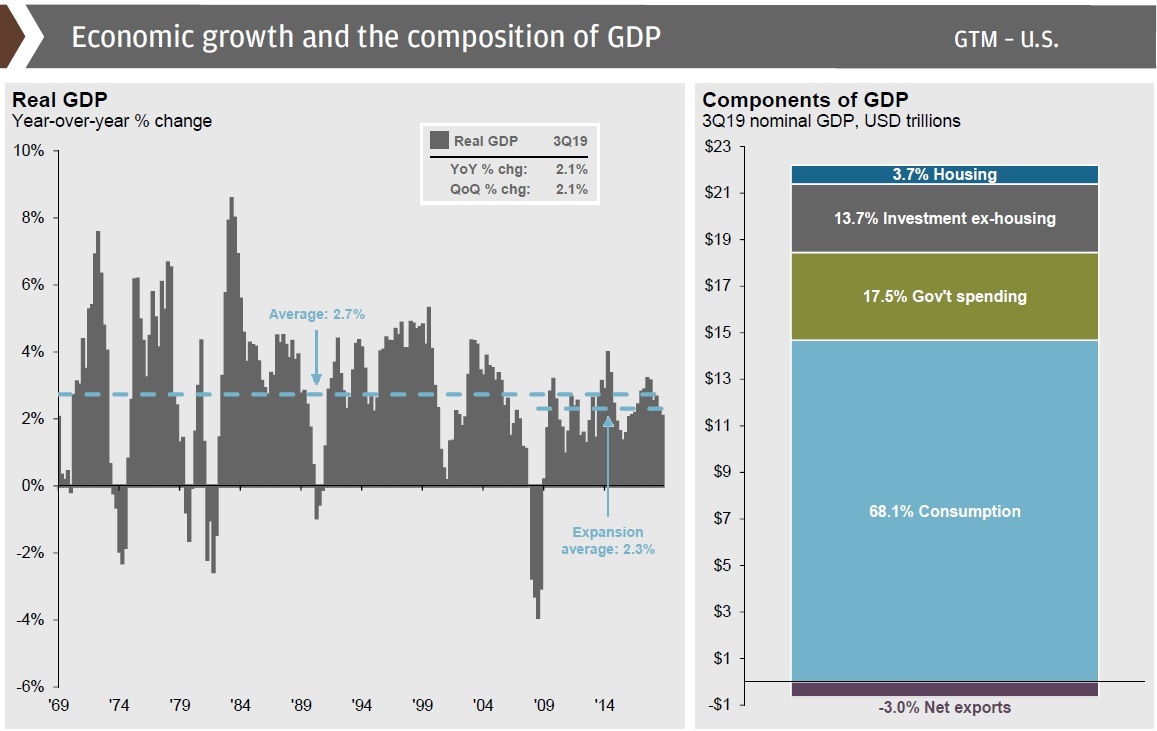
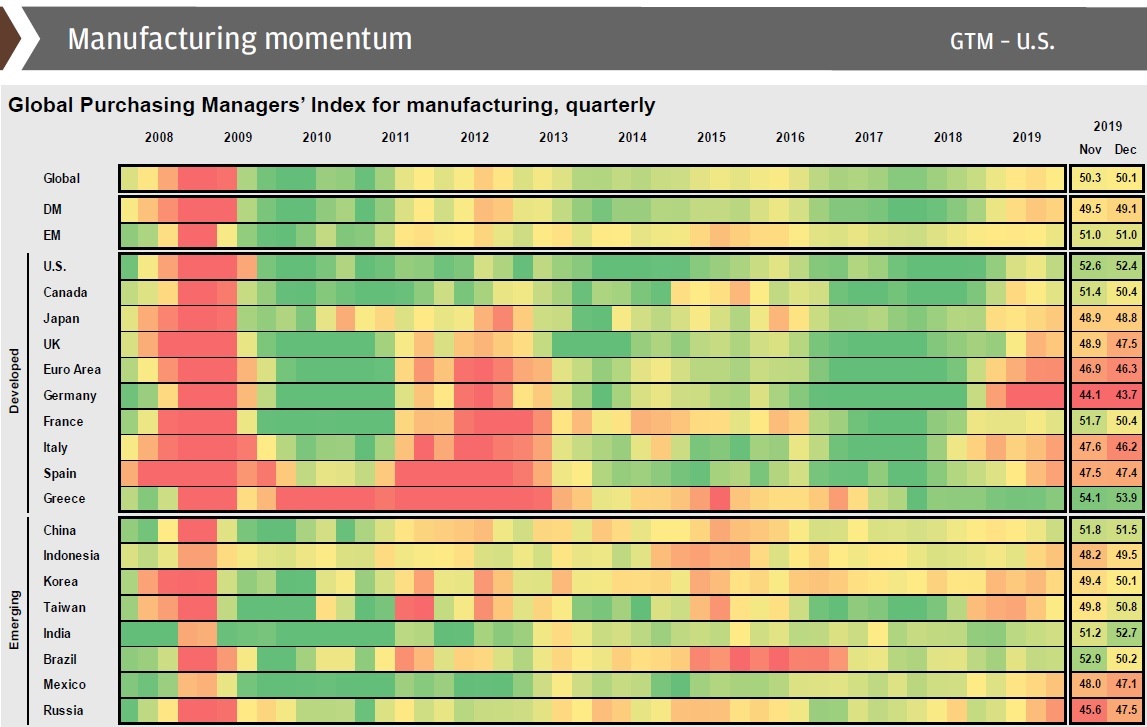
8 & 9: Global GDP growth slowed as expected in 2019
Last year, we speculated a reversion to about 2.0% in 2019 was a likely outcome. Actual Q3 year-over-year growth was 2.1%. Looking to 2020, the U.S. economy could see a bump if any of the economic headwinds (for instance, the U.S.-China trade dispute) were removed, with additional Quantitative Easing (QE) or with a continued “lower for longer” rate strategy at the Fed.
The Purchasing Manager’s Index (PMI – measure of manufacturing strength) data shows that only a handful of global economies continue to operate in expansion mode.
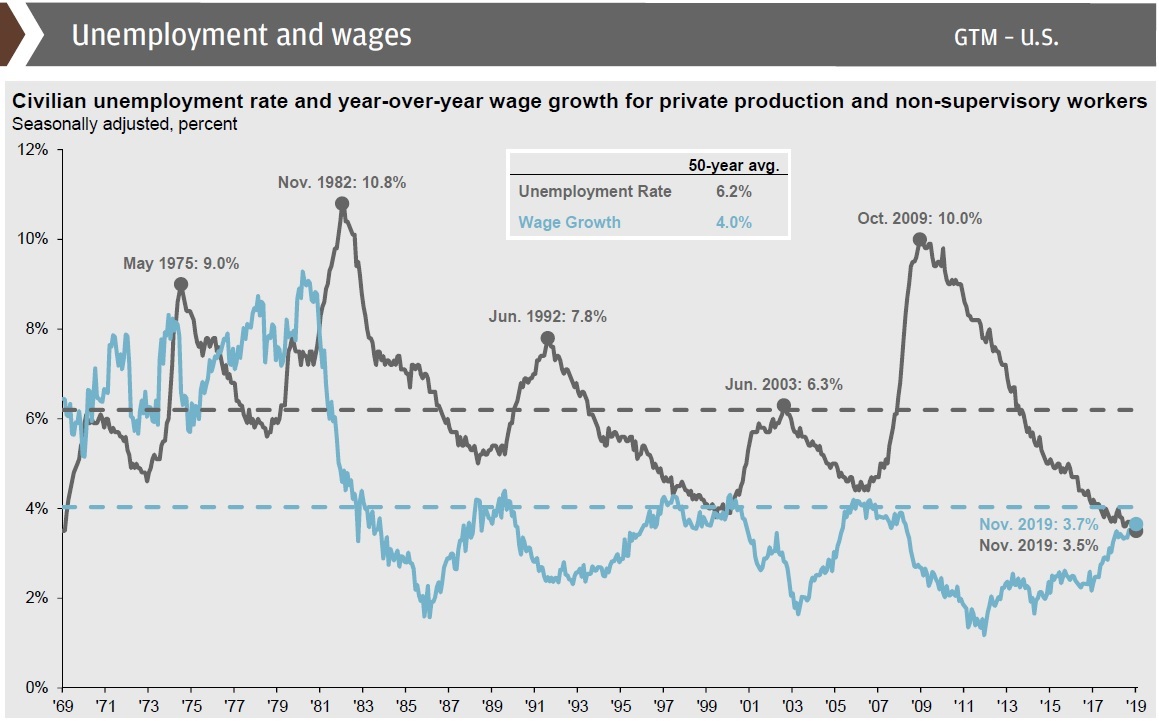
10: U.S. unemployment hit lowest level since the late-60s
Unemployment hit a 50-year low in 2019. Persistent factors limiting labour force growth (baby boomers retiring, tight immigration policy, etc.) remain. Wage growth also ticked upward from 3.2% in November 2018 to 3.7% in November 2019.
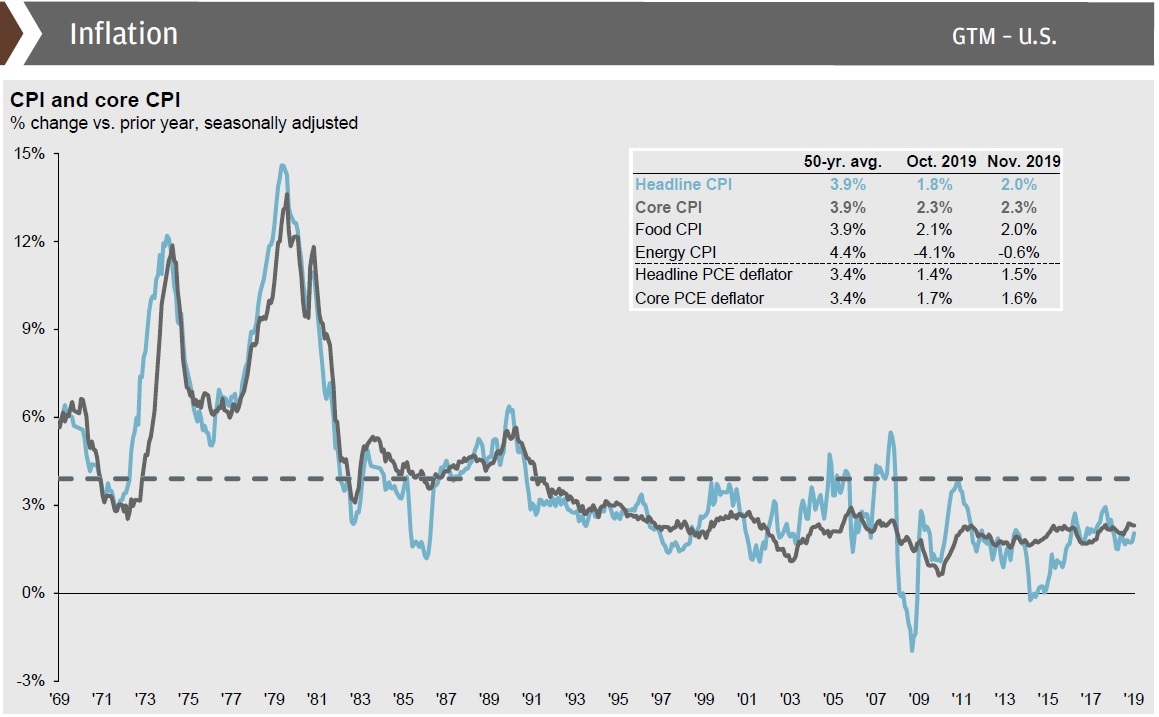
11: Inflation was stable 2019, but expect an uptick in 2020
U.S. inflation, measured by the personal consumption deflator, dropped from 2018 levels (1.9%) and sat at 1.6% as of November 2019. Rising wages and lowering unemployment have not impacted inflation as one might expect. The U.S. Federal Reserve (the Fed) will likely continue its “lower for longer” rate strategy to stimulate inflation up toward the Fed’s 2.0% target.
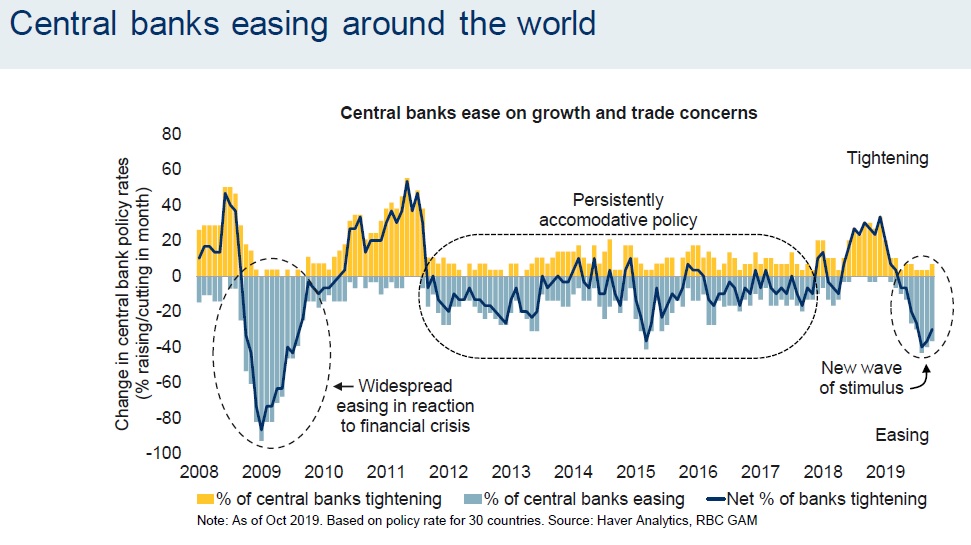
12: U.S. Central Bank changes course, lowering key rate
After slowly raising rates the last few years, the Fed and other central banks around the world made an abrupt 180 in 2019 and cut their key rates. Global Central Bank activity could be described as “over-reactionary” in 2018, as tightening effects helped lead markets downward to end the year. 2019 saw a reverse, with nearly 40% of central banks easing throughout 2019.
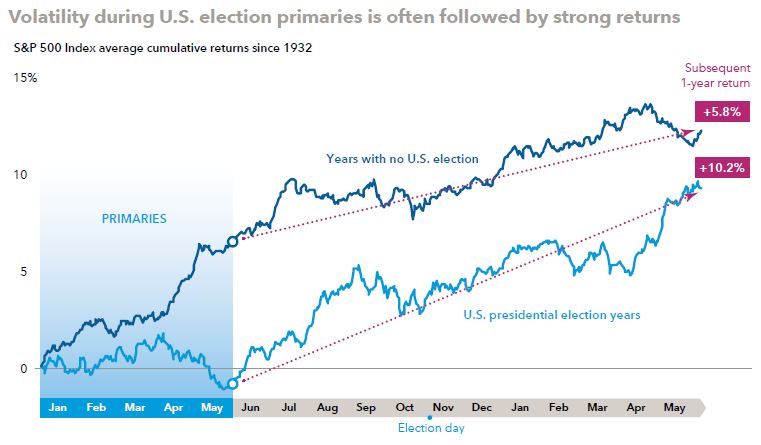
13: Volatility during U.S. election primaries is often followed by strong returns
Historically speaking, whether a Democrat or Republican is elected President has had little bearing on market results. However, investors who chose to ride out the volatility experienced during primary season tend to be rewarded in the following 12 months.
14: Brexit will hurt the United Kingdom’s GDP…
Note that this chart was as of October 31, 2019. As expected, Boris Johnson was elected Prime Minister of the United Kingdom. The most likeliest Brexit outcome is Johnson’s “Soft” Brexit*, which would still negatively impact the U.K.’s GDP. However, this outcome would still be superior to the “Middling” or the “Hard” Brexit scenarios.
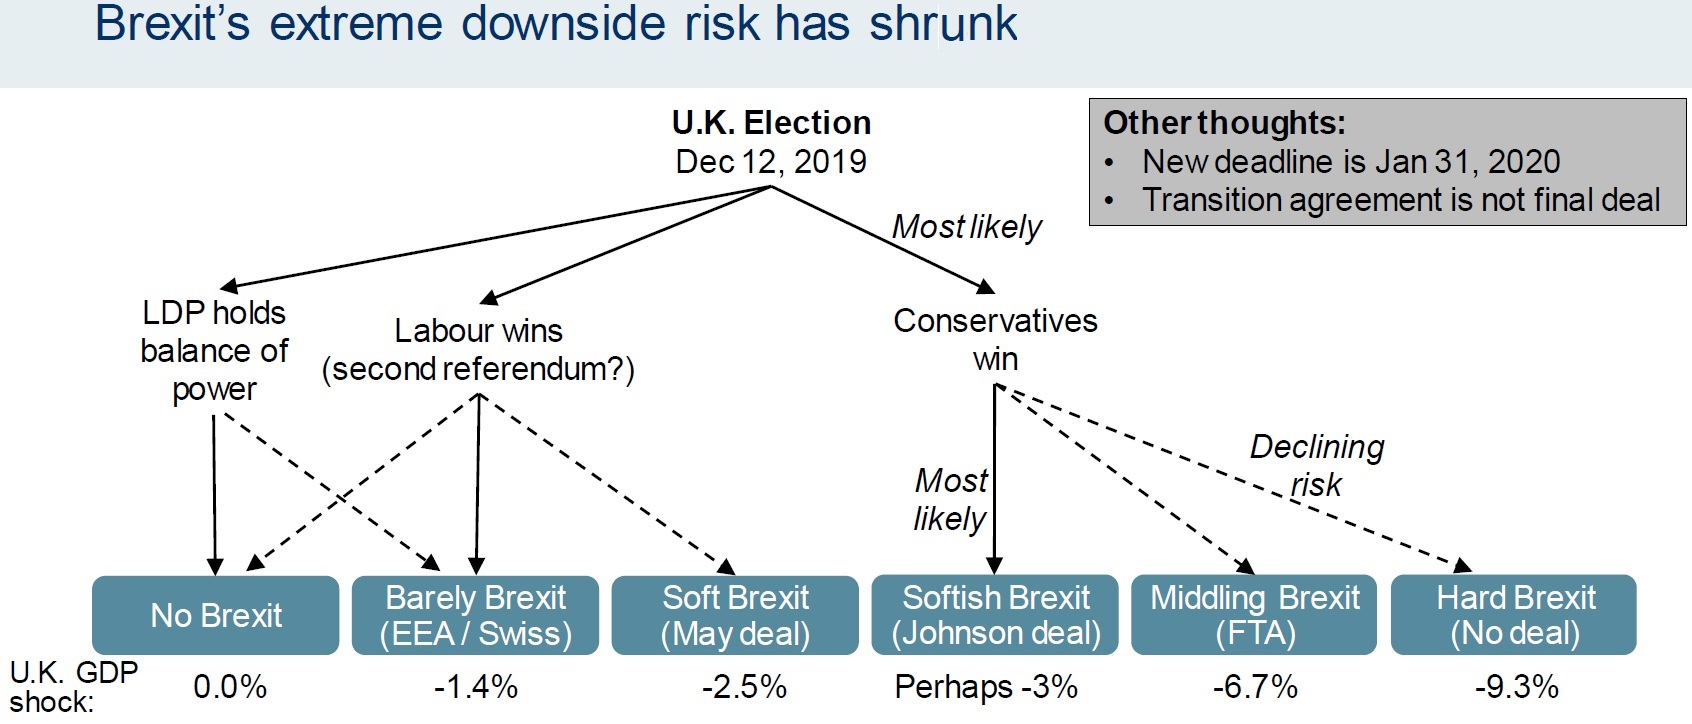
*Editor’s Note: This week, parliament voted Boris Johnson’s “Withdrawal Agreement Act” into U.K. law. The U.K. is now set to leave the European Economic Union on January 31st.
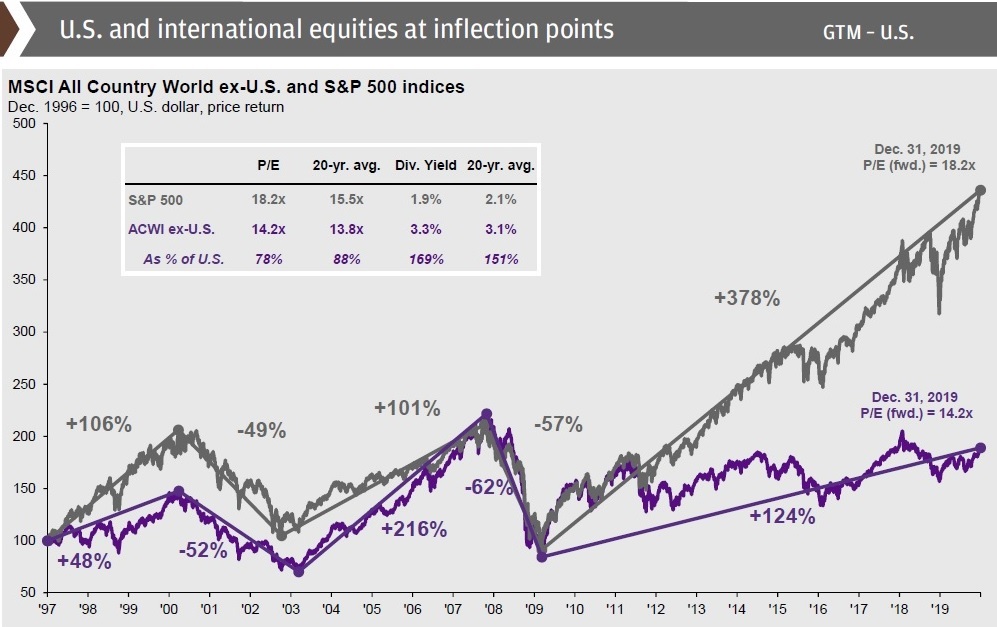
15: …But international equities continue to offer long-term opportunities
Structural issues in Europe have resulted in lower valuations for European equities relative to the U.S. Historically, the U.S. and Europe have had alternating periods of outperformance.
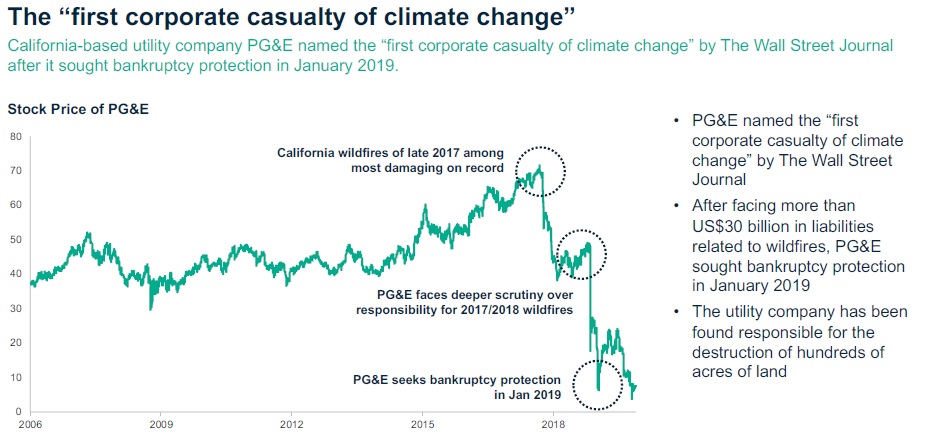
16: Climate change’s first “corporate casualty”
2018 saw California wildfires run out of control, culminating with the so-called “Camp Fire” which caused ≈ $7 Billion in property damages, including the complete destruction of over 14,000 homes in November. Lawsuits ensued. The Pacific Gas & Electric Corporation (PG&E), under extreme financial duress due to the incoming lawsuits, filed for Chapter 11 Bankruptcy protection on January 29, 2019. PG&E is now widely cited as the first corporate casualty of climate change.
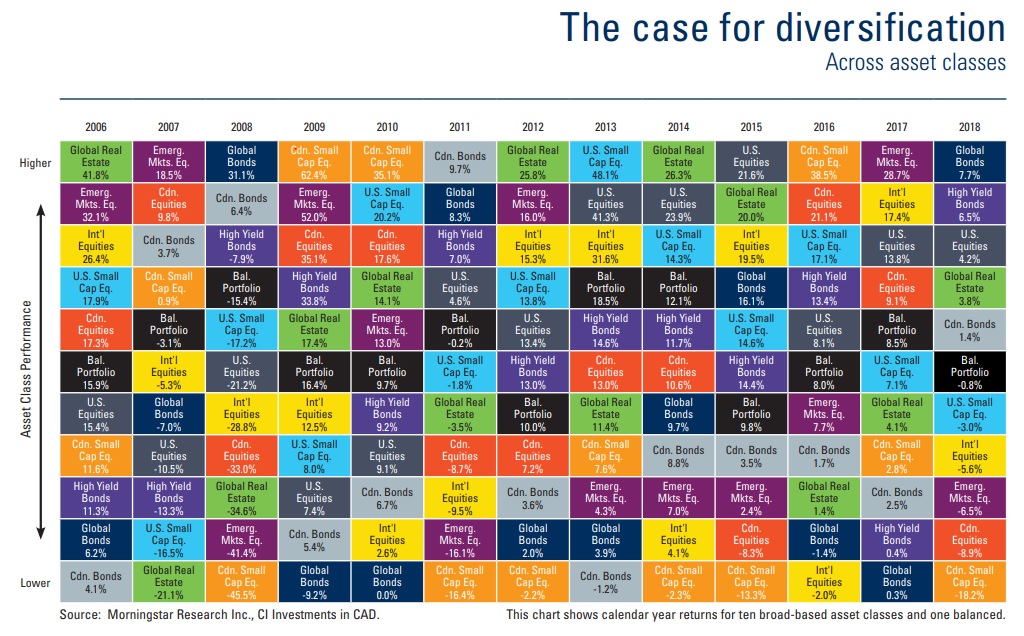
17: Broad diversification is a great risk-mitigator
2019 returns exceeded most analysts’ expectations and there is reason to be cautiously optimistic as we look ahead to 2020. With valuations for many assets near record highs, a well-diversified investment portfolio can help to maximize returns and mitigate risks as they occur.
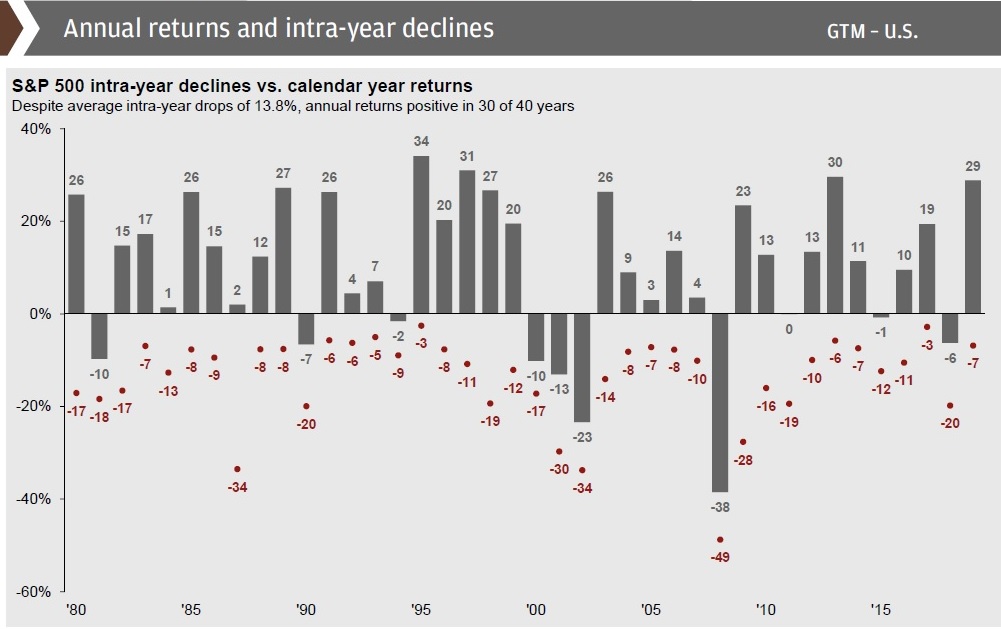
18: Intra-year declines happen every year, don’t panic!
History has shown that a large majority of calendar years see at least one market pullback of 5% or more. Last year was a perfect example of this, with the S&P 500 finishing up 29%, but declining 7% in May. It is generally a good idea to ride out the volatility, as markets always rebound over time.
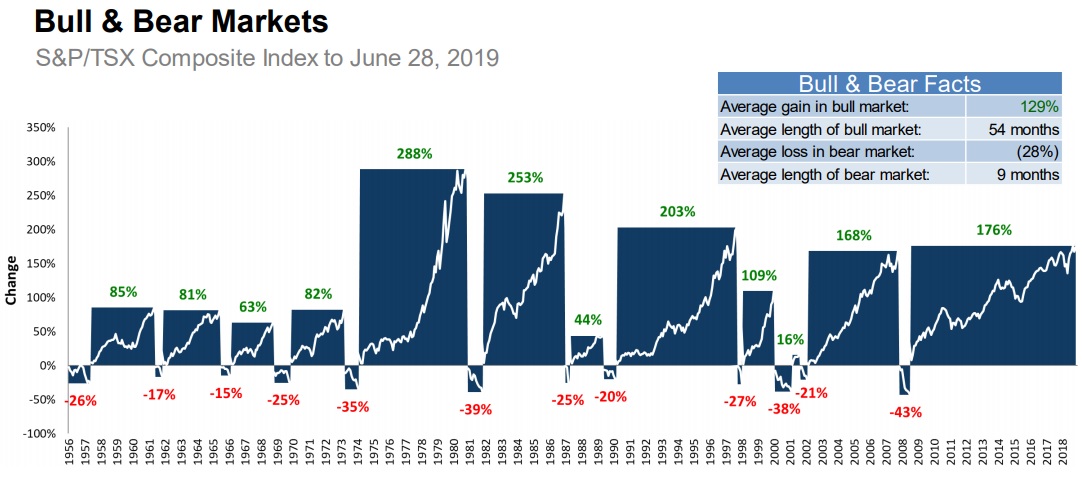
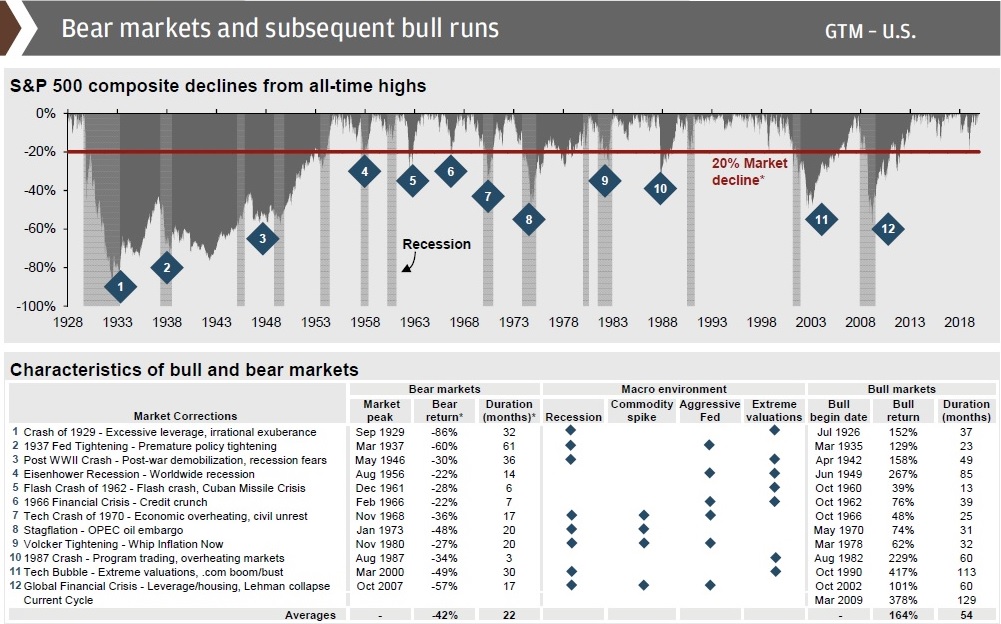
19 & 20: Bull (rising) markets are longer and stronger and last longer than bear (declining) markets
Going back to the mid-1950s, the average bull market gain has seen the TSX gain 129% with an average length of 54 months, while the average bear market sees the TSX drop by 28% while lasting only 9 months. As we can see, bull markets last longer and more than make up for their preceding bears.
Using data going back to The Great Depression, we see that the average S&P 500 bull market is also 54 months and the average total return is 164%, whereas the average bear market lasts 22 months but sees a 42% drop. Once again, the average bull market lasts longer and gains more than the preceding bear market lasts & drops.
Sources: Capital Group, Fidelity, JP Morgan, RBC GAM, NEI Investments, Mackenzie, Forbes.com, CI Investments, Sky News
This information is provided for general information purposes only. It does not constitute professional advice. Please contact a professional about your specific needs before taking any action.